

Port of Tauranga describes its response to climate change in its annual Climate-related Disclosures report, first published in 2024 under new rules for NZX-listed companies:
Port of Tauranga CRD report FY2024
Port of Tauranga CRD report FY2025
Port of Tauranga CRD report FY2026
The reports outline:
- Governance – oversight of the Port's response to climate change by the management team and Board of Directors
- Risk management – how the Port identifies, assesses and manages climate-related risk
- Strategy – the current and future impacts of climate change and the transition to a low-emissions economy (and what we are doing about them)
- Metrics and targets – the Port's current emissions inventory, its decarbonisation plan and targets
The Port has mapped its emissions inventory and assessed risks and opportunities across its value chain:
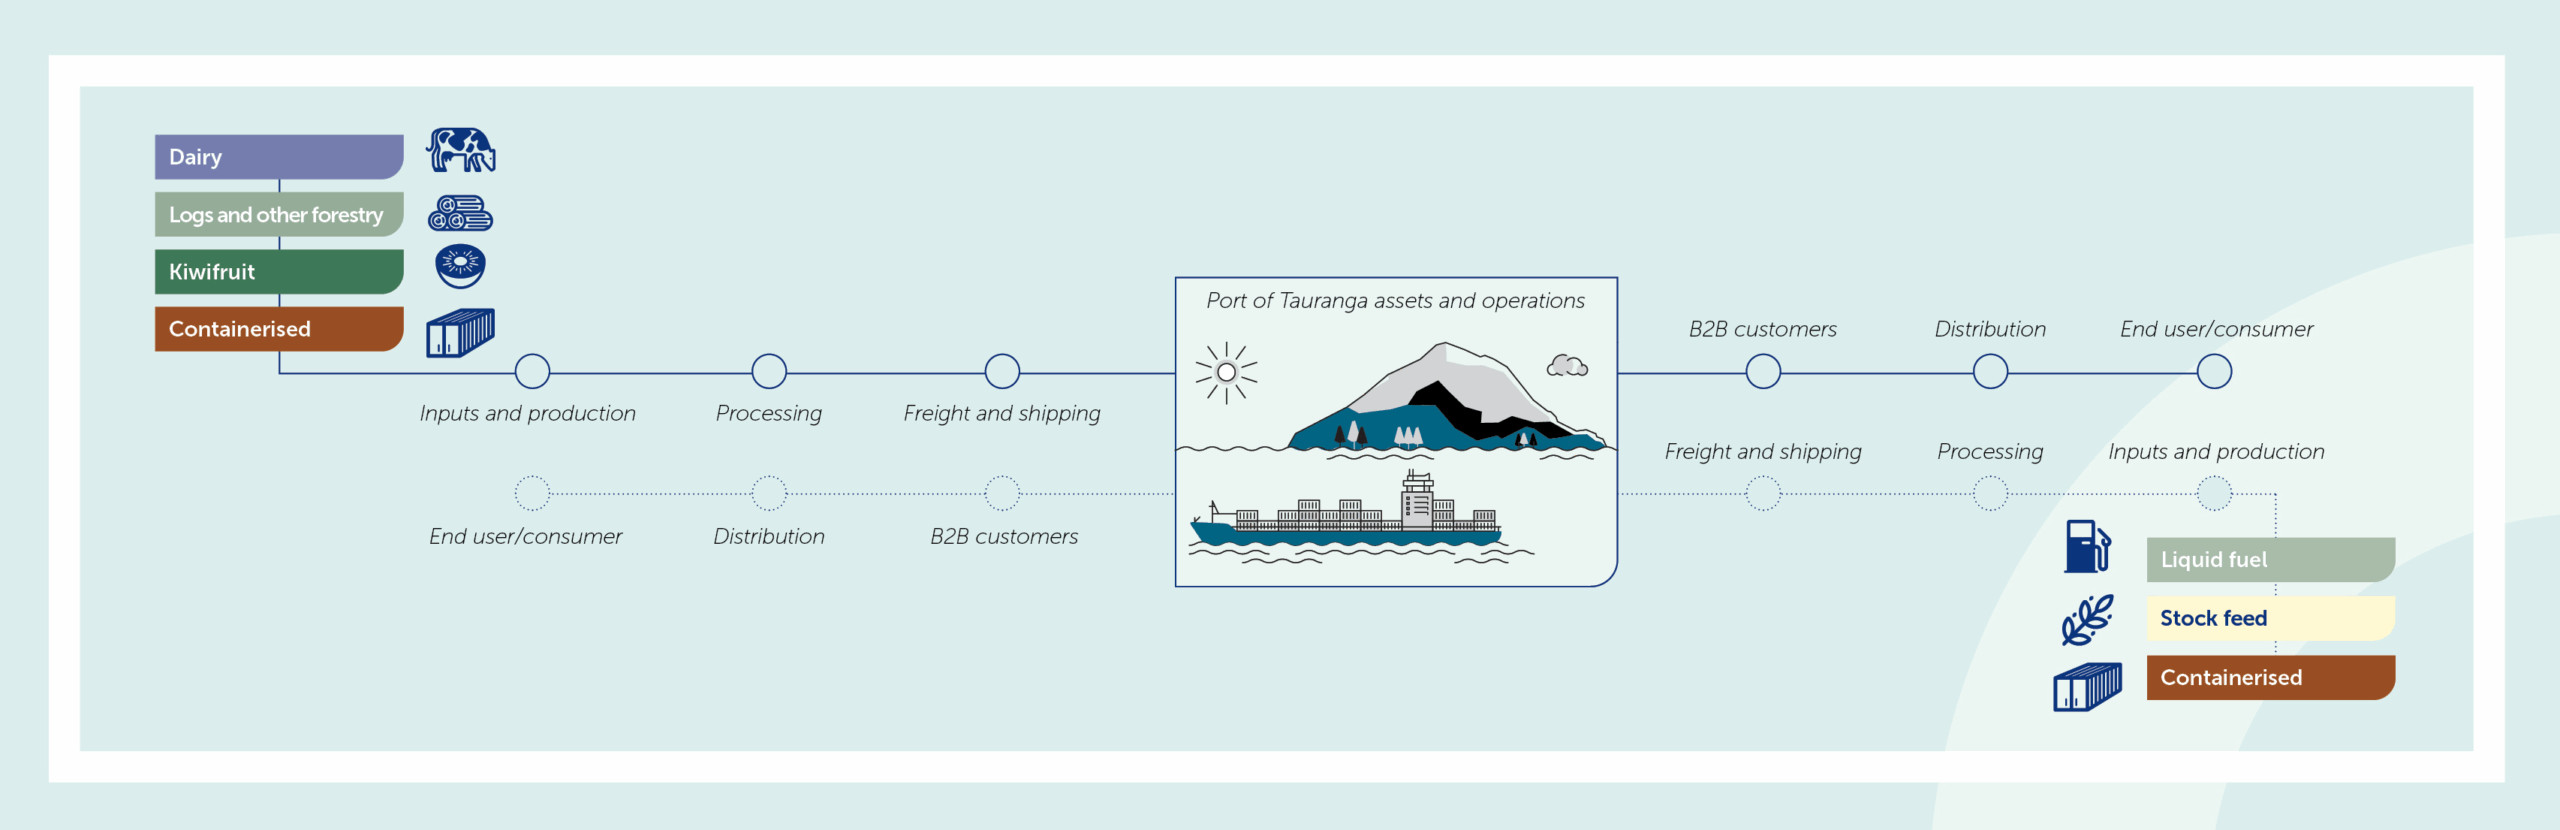
The Port has examined how it might perform under a range of potential futures, drawing on scenarios developed by the agricultural, transport and energy sectors:
- Orderly: global warming is kept to 1.4 degrees Celsius by 2100
- Disorderly: global warming is kept to 2.6 degrees Celsius by 2100
- Hothouse: global warming reaches 3.9 degrees Celsius by 2100.
Risks and opportunities
The climate-related risks and opportunities identified for Port of Tauranga include:
| Direct physical risks | Indirect physical risks (value chain) |
|---|---|
|
|
| Direct transition opportunities | Indirect transition opportunities (value chain) |
|---|---|
|
|
Metrics and targets
Absolute Scope 1 and 2 emissions for FY2026 are 19.2 kt CO₂e, down 12% from FY2025 (21.9 kt CO₂e) and up 1% from the FY2023 base year (19.1 kt CO₂e). The Scope 1 and 2 emissions intensity for FY2026 is 0.00076 t CO₂e per cargo tonne. This is a 9% decrease compared to FY2025 (0.00084 t CO₂e) and a 2% increase compared to the FY2023 base year (0.00075 t CO₂e).
The decrease in emissions for FY2026 from FY2025 can be attributed to two main things:
1. The Ministry for the Environment’s location-based electricity emissions factor for FY2026 has decreased by 22% compared to the EF used in FY2025. This change is driven by a shift in electricity generation with a higher proportion of renewable sources being used, whereas the FY2025 EF reflected increased reliance on fossil fuels in the national electricity mix.
2. Diesel generator emissions at the Tauranga Container Terminal (TCT) decreased by 41% compared with FY2025. Generators are used during peak periods when demand for refrigerated container (reefer) power exceeds the capacity of the existing electric plug-in infrastructure. This significant decrease was driven by several actions taken in response to increasing generator emissions in FY2025 and include both operational and infrastructure improvements.

